Market Outlook
May 12, 2017
Market Cues
Domestic Indices
Chg (%)
(Pts)
(Close)
Indian markets are likely to flat tracking the SGX Nifty and Asian markets.
BSE Sensex
0.00.3
3
86
30,251
US stocks started lower but rallied to close slightly negative for the session. US
Nifty
0.20.4
1533
9,4226
producer price index for final demand climbed by 0.5 percent in April against
Mid Cap
0.10.7
8
95
14,957
expectations of a price rise by 0.2 percent. Core producer prices rose by 0.4 percent
Small Cap
(0.1)1.1
(8)71
15,653
in April and were up by 1.9 percent YoY.
Bankex
0.0
8
25,949
UK stock indices closed flat yesterday after the Bank of England's rate-setting body
decided to hold interest rates steady in a split. The Bank of England also
Global Indices
Chg (%)
(Pts)
(Close)
downgraded its
2017 growth outlook to
1.9 percent from
2 percent, citing
weakening household spending. However, the bank lifted the growth projection for
Dow Jones
(0.1)
(24)
20,919
2018 to 1.7 percent from 1.6 percent and for 2019 to 1.8 percent from 1.7 percent.
Nasdaq
(0.2)
(13)
6,116
FTSE
0.0
1
7,387
Indian markets ended Thursday’s session slightly higher as the indices continued to
reach new highs. The consumer durables index was the biggest gainer from the
Nikkei
(00.3
61
19,962
session and closed up 1.65 percent. The oil and Gas index lost 0.93 percent on
Hang Seng
0.4
110
25,126
profit booking.
Shanghai Com
0.3
9
3,062
Result Preview & Review
Advances / Declines
BSE
NSE
Dr Reddy’s Lab Q4FY17 Preview
Advances
1,234
1,678
HCL Tech Q4FY17 Review
Declines
1,630
991
Detailed analysis on Pg2
Unchanged
149
81
Investor’s Ready Reckoner
Volumes (` Cr)
Key Domestic & Global Indicators
BSE
4,031
Stock Watch: Latest investment recommendations on 150+ stocks
Refer Pg6 onwards
NSE
25,387
Top Picks
#Net Inflows (` Cr)
Net
Mtd
Ytd
CMP
Target
Upside
Company
Sector
Rating
(`)
(`)
(%)
FII
(1,365
(2,2(32)
41,980
Blue Star
Capital Goods
Accumulate
676
760
12.5
MFs
8924
3,413
24,095
Dewan Housing Fin. Financials
Buy
442
520
17.7
Mahindra Lifespace Real Estate
Accumulate
459
522
13.6
Top Gainers
Price (`)
Chg (%)
Navkar Corporation Others
Buy
218
265
21.7
KEI Industries
Capital Goods
Accumulate
222
239
7.7
Adanitrans
184
9.9
More Top Picks on Pg4
Unitdspr
2,135
8.7
Ubl
850
5.8
Key Upcoming Events
Previous
Consensus
Zeel
545
5.7
Date
Region
Event Description
Reading
Expectations
Eichermot
29,402
5.6
May 12, 2017 India
Imports YoY%
45.30
--
May 12, 2017 US
Consumer price index (mom)
(0.30)
0.20
Top Losers
Price (`)
Chg (%)
May 12, 2017 India
Exports YoY%
27.60
--
May 12, 2017 India
Industrial Production YoY
(1.20)
1.90
Abb
1,529
(4.4)
May 12, 2017 Germany GDP nsa (YoY)
1.20
2.80
Siemens
1,405
(3.8)
May 12, 2017 India
Monthly Wholesale Prices YoY%
5.70
4.50
Gsfc
140
(3.8)
More Events on Pg5
Marksans
52
(3.4)
Welcorp
84
(3.4)
#As on May 11, 2017
Market Outlook
May 12, 2017
Result Preview
Dr Reddy’s Lab (CMP: `2,592 / TP: / Upside: )
The company for its 4QFY2017 results is expected to post top line growth of 7.0%
yoy to end the period at `4,020cr, mainly driven by India region. On the operating
front, EBIT margin is expected to come in at 16.0% V/s 13.5% in 3QFY2016, a
expansion of 2.5% yoy. EBDITA margin is expected to be 23.0% in 4QFY2017 V/s
22.5% in 4QFY2016. Thus, PAT is expected to come in at `484cr V/s `75cr in
4QFY2016.
Given the valuations, we maintain our neutral rating on the stock.
Result Review
HCL Tech (CMP: `839 / TP: `1,000 / Upside: 19.2%)
The company, posted 4QFY2017 results better than expected. In US$ the revenues
came in at US$1,817mn V/s US$1,810mn expected V/s US$1,745mn in
3QFY2017, a qoq growth of 4.1%. In rupee terms, the revenue is expected to
grow by 2.0% qoq to `12,053cr V/s `12,064cr expected V/s `11,814cr in
3QFY2017. On constant Currency (CC) basis, company posted a 3.8% qoq
growth.
On the growth front; USA posted a CC qoq growth of 5.3%, Europe posted a dip
of 3.0% CC and ROW posted a CC qoq growth of 15.8%. In terms, of verticals the
Financial services posted a CC qoq growth of 3.0%, Manufacturing posted a CC
qoq growth of 6.3%, Lifesciences & Healthcare posted a CC qoq growth of 0.1%,
Public Services posted a CC qoq growth of 8.1%, while Retail & CPG posted a CC
qoq growth of 2.1%. The vertical which posted a dip was Telecommunication,
Media, and Publishing & Entertainment which came in at 2.1%.
On the operating front, EBITDA margin came in at 22.0% V/s 21.9% expected V/s
22.2% in 3QFY2017, a dip of 20ps qoq, while the EBIT, came in at 20.0% V/s
20.1% expected V/s 20.4% in 3QFY2017, 40bps qoq dip. Thus, PAT came in at
`2,325cr V/s `1,982cr expected V/s `2,070cr in 3QFY2017, down 12.3% qoq.
Strong client addition: $5+ mn clients up by 13, $10+ mn clients up by 9, $20+
mn clients up by 10, $40+ mn clients up by 5, and $50+ mn clients up by 6.
For FY'2018 revenues are expected to grow between 10.5% to 12.5% in Constant
Currency (CC). Revenue Guidance is based on FY’17 (April to March) average
exchange rates. The above constant currency guidance translates to 9.9% to
11.9% in US$ terms based on March 31, 2017 rates. On the operating Margin
(EBIT), with FY2018 is expected to come in the range is from 19.5% to 20.5%.
Given the valuations, we maintain our buy rating with target price of `1,000.
Market Outlook
May 12, 2017
Economic and Political News
Odisha Cabinet approves GST Bill
NHAI's launches its first Masala Bond in UK
Retail inflation likely to cool in April on lower food prices
Corporate News
CCI to probe Idea, Vodafone, Airtel on complaints regarding alleged
cartelization
Over half of US based workforce are locals: HCL Technologies
TCS starts BPO centre in Patna
Granules India's Q4 net profit up 38% YoY at `45 cr
Market Outlook
May 12, 2017
Quarterly Bloomberg Brokers Consensus Estimate
Dr Reddy's Laboratories Ltd Consol - May 12, 2017
Particulars ( ` cr)
4QFY17E
4QFY16
y-o-y (%)
3QFY17
q-o-q (%)
Net sales
3,674
3,756
(2.2)
3,707
(0.9)
EBITDA
807
810
(0.4)
871
(7.4)
EBITDA margin (%)
22.0
21.6
23.5
Net profit
424
506
(16.2)
492
(14.0)
Nestle India Ltd - May 12, 2017
Particulars ( ` cr)
1QCY17E
1QCY16
y-o-y (%)
4QCY16
q-o-q (%)
Net sales
2,572
2,296
12.0
2,261
13.7
EBITDA
560
479
16.9
446
25.4
EBITDA margin (%)
21.8
20.9
19.7
Net profit
338
259
30.7
167
102.4
Titan Co Ltd - May 12, 2017
Particulars ( ` cr)
4QFY17E
4QFY16
y-o-y (%)
3QFY17
q-o-q (%)
Net sales
3,266
2,437
34.0
3,871
(15.6)
EBITDA
327
210
55.7
374
(12.4)
EBITDA margin (%)
10.0
8.6
9.6
Net profit
225
184
21.9
181
24.2
Idea Cellular Ltd Consol - May 13, 2017
Particulars ( ` cr)
4QFY17E
4QFY16
y-o-y (%)
3QFY17
q-o-q (%)
Net sales
8,219
9,463
(13.1)
8,661
(5.1)
EBITDA
1,892
3,616
(47.7)
2,165
(12.6)
EBITDA margin (%)
23.0
38.2
25.0
Net profit
(703)
576
0.0
(384)
0.0
Vedanta Consol - May 15, 2017
Particulars ( ` cr)
4QFY17E
4QFY16
y-o-y (%)
3QFY17
q-o-q (%)
Net sales
21,934
15,829
38.6
19,320
13.5
EBITDA
7,226
3,472
108.1
5,996
20.5
EBITDA margin (%)
32.9
21.9
31.0
Net profit
2,856
955
199.1
1,866
53.0
Market Outlook
May 12, 2017
Top Picks
Market Cap
CMP
Target
Upside
Company
Rationale
(` Cr)
(`)
(`)
(%)
Strong growth in domestic business due to its leadership
in acute therapeutic segment. Alkem expects to launch
Alkem Laboratories
23,002
1,924
2,257
17.3
more products in USA, which bodes for its international
business.
We expect the company would report strong profitability
Asian Granito
1,162
386
405
4.9
owing to better product mix, higher B2C sales and
amalgamation synergy..
Favourable outlook for the AC industry to augur well for
Cooling products business which is out pacing the market
Blue Star
6,458
676
760
12.5
growth. EMPPAC division's profitability to improve once
operating environment turns around..
With a focus on the low and medium income (LMI)
consumer segment, the company has increased its
Dewan Housing Finance
13,837
442
520
17.7
presence in tier-II & III cities where the growth opportunity
is immense.
Strong loan growth backed by diversified loan portfolio
and adequate CAR. ROE & ROA likely to remain decent
Equitas Holdings
5,584
165
235
42.2
as risk of dilution remains low. Attractive valuations
considering growth.
Economic recovery to have favourable impact on
advertising & circulation revenue growth. Further, the
Jagran Prakashan
6,308
193
225
16.6
acquisition of a radio business (Radio City) would also
boost the company's revenue growth.
High order book execution in EPC segment, rising B2C
KEI Industries
1,724
222
239
7.7
sales and higher exports to boost the revenues and
profitability
Speedier execution and speedier sales, strong revenue
Mahindra Lifespace
1,886
459
522
13.6
visibilty in short-to-long run, attractive valuations
Massive capacity expansion along with rail advantage at
Navkar Corporation
3,105
218
265
21.7
ICD as well CFS augurs well for the company
Strong brands and distribution network would boost
Siyaram Silk Mills
1,600
1,707
1,872
9.7
growth going ahead. Stock currently trades at an
inexpensive valuation.
Market leadership in Hindi news genre and no.
2
viewership ranking in English news genre, exit from the
TV Today Network
1,639
275
344
25.2
radio business, and anticipated growth in ad spends by
corporates to benefit the stock.
Source: Company, Angel Research
Market Outlook
May 12, 2017
Key Upcoming Events
Result Calendar
Date
Company
May 12, 2017
Oriental Bank, UCO Bank, Relaxo, Dr Reddy's, GIPCL, S H Kelkar & Co., Quick Heal
May 13, 2017
Mangalam Cement, J & K Bank
May 15, 2017
JK Tyre, South Ind.Bank
May 16, 2017
Punjab Natl.Bank, Andhra Bank, Tata Steel, Dishman Pharma, Transport Corporation of India
May 17, 2017
J K Lakshmi Cements, Allahabad Bank, HUL, NIIT, JSW Steel , UFO Moviez
Bajaj Auto, Automotive Axle, Cummins India, Bank of Baroda, Hindustan Media Ventures, Jyothy Laboratories, CESC,
May 18, 2017
Coffee Day Enterprises Ltd
Source: Bloomberg, Angel Research
Global economic events release calendar
Date
Time
Country
Event Description
Unit
Period
Bloomberg Data
Last Reported Estimated
May 12, 2017
India
Imports YoY%
% Change
Apr
45.30
--
6:00PM US
Consumer price index (mom)
% Change
Apr
(0.30)
0.20
India
Exports YoY%
% Change
Apr
27.60
--
5:30PM India
Industrial Production YoY
% Change
Mar
(1.20)
1.90
11:30AM Germany
GDP nsa (YoY)
% Change
1Q P
1.20
2.80
5:00PM India
Monthly Wholesale Prices YoY%
% Change
Apr
5.70
4.50
May 15, 2017 7:30AM China
Industrial Production (YoY)
% Change
Apr
7.60
7.00
May 16, 2017 2:30PM Euro Zone
Euro-Zone GDP s.a. (QoQ)
% Change
1Q P
0.50
--
6:00PM US
Housing Starts
Thousands
Apr
1,215.00
1,250.00
6:00PM US
Building permits
Thousands
Apr
1,267.00
1,270.00
6:45PM US
Industrial Production
%
Apr
0.55
0.40
2:00PM UK
CPI (YoY)
% Change
Apr
2.30
2.60
May 17, 2017 2:30PM Euro Zone
Euro-Zone CPI (YoY)
%
Apr F
1.90
--
7:30PM Euro Zone
Euro-Zone Consumer Confidence
Value
May A
(3.60)
--
May 19, 2017 2:00PM UK
Jobless claims change
% Change
Apr
25.50
--
May 23, 2017 7:30PM US
New home sales
Thousands
Apr
621.00
620.00
May 24, 2017 1:00PM Germany
PMI Services
Value
May P
55.40
--
1:00PM Germany
PMI Manufacturing
Value
May P
58.20
--
7:30PM US
Existing home sales
Million
Apr
5.71
5.68
May 25, 2017 2:00PM UK
GDP (YoY)
% Change
1Q P
2.10
--
May 26, 2017 6:00PM US
GDP Qoq (Annualised)
% Change
1Q S
0.70
0.70
May 30, 2017 7:30PM US
Consumer Confidence
S.A./ 1985=100
May
120.30
--
May 31, 2017 1:25PM Germany
Unemployment change (000's)
Thousands
May
(15.00)
--
2:00PM UK
PMI Manufacturing
Value
May
57.30
--
Source: Bloomberg, Angel Research
Market Outlook
May 12, 2017
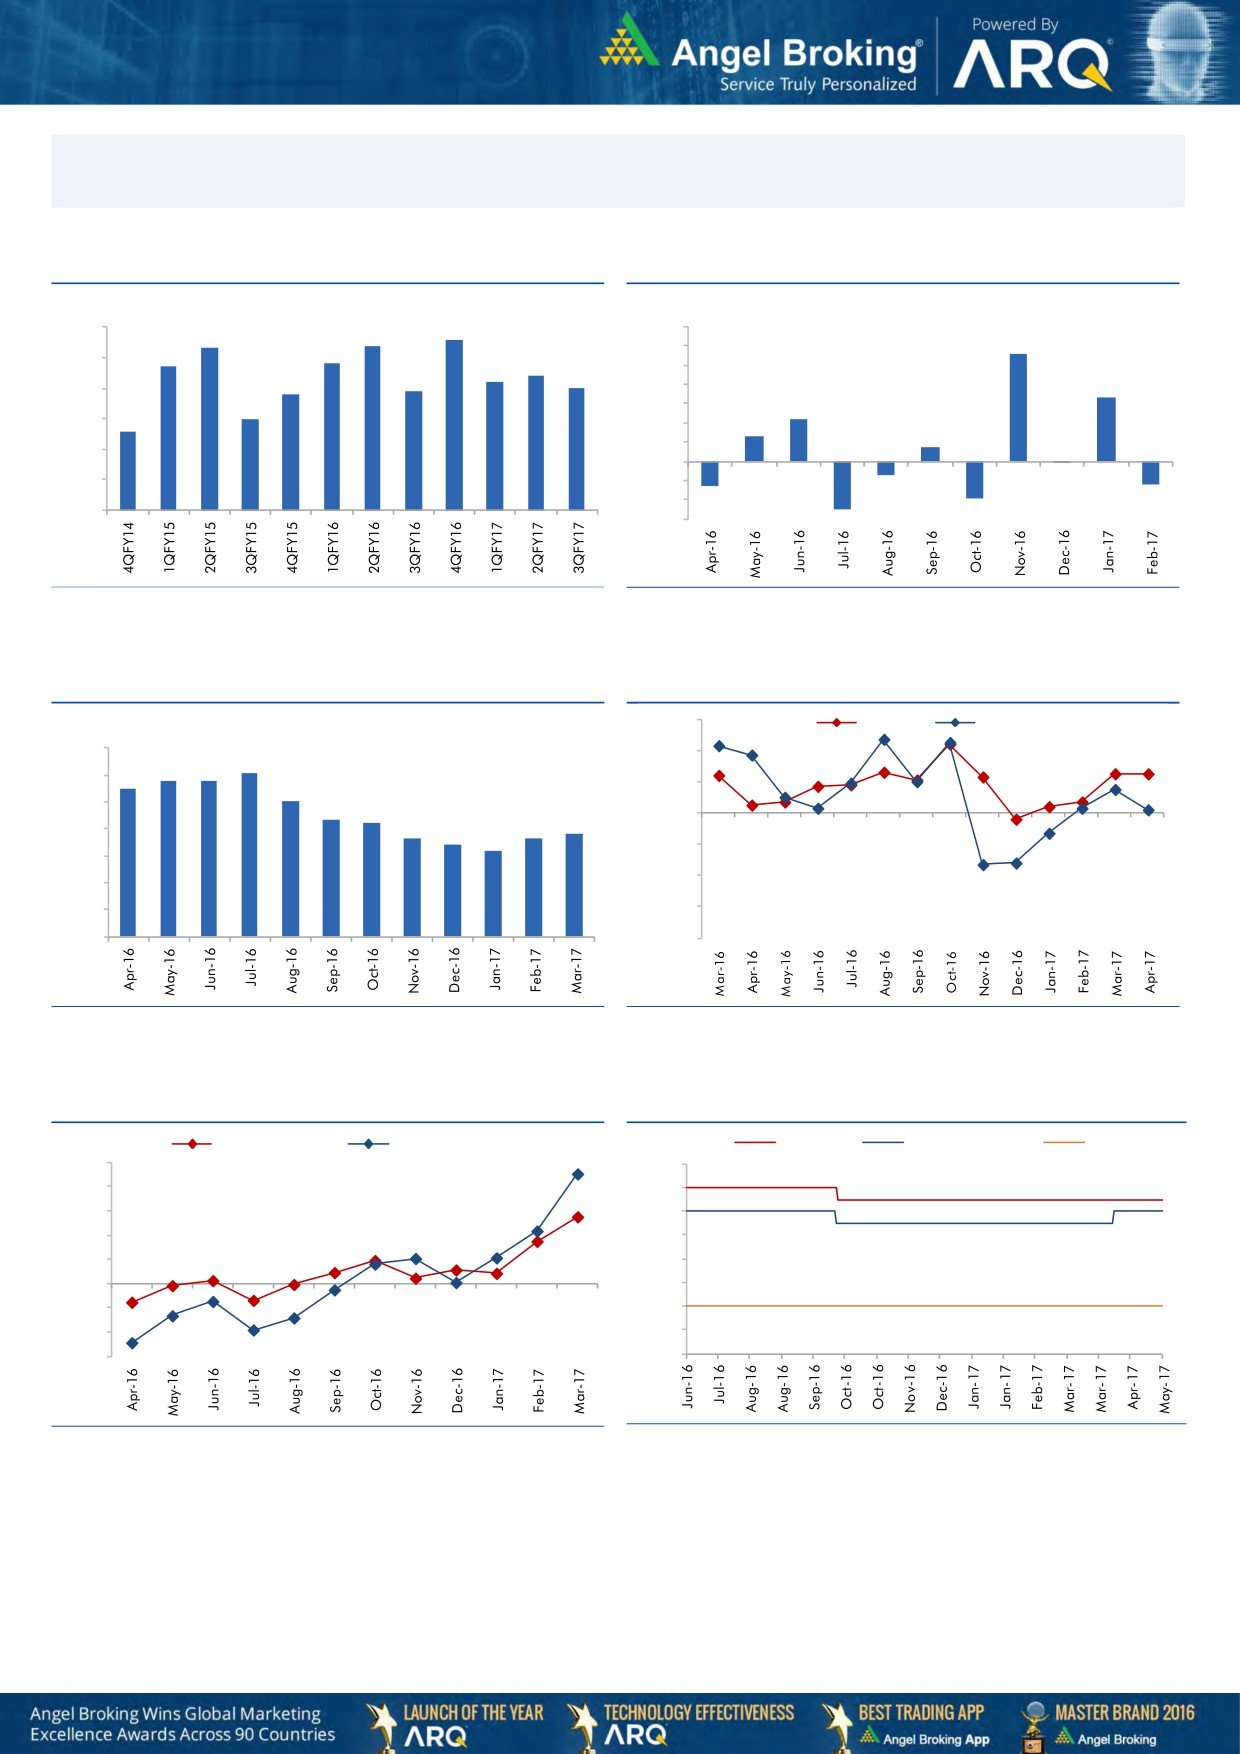
Macro watch
Exhibit 1: Quarterly GDP trends
Exhibit 2: IIP trends
(%)
(%)
8.6
9.0
8.3
8.4
7.0
5.6
7.7
7.8
6.0
8.0
7.4
7.2
5.0
6.9
7.0
6.8
4.0
3.3
7.0
6.0
3.0
2.2
6.0
5.6
1.3
2.0
0.7
1.0
5.0
-
4.0
(1.0)
(0.1)
(0.7)
(2.0)
(1.3)
(1.2)
3.0
(3.0)
(1.9)
(2.5)
Source: CSO, Angel Research
Source: MOSPI, Angel Research
Exhibit 3: Monthly CPI inflation trends
Exhibit 4: Manufacturing and services PMI
56.0
Mfg. PMI
Services PMI
(%)
7.0
54.0
6.1
5.8
5.8
6.0
5.5
5.1
52.0
5.0
4.3
4.2
3.8
50.0
3.6
3.7
4.0
3.4
3.2
48.0
3.0
46.0
2.0
1.0
44.0
-
42.0
Source: MOSPI, Angel Research
Source: Market, Angel Research; Note: Level above 50 indicates expansion
Exhibit 5: Exports and imports growth trends
Exhibit 6: Key policy rates
(%)
Exports yoy growth
Imports yoy growth
(%)
Repo rate
Reverse Repo rate
CRR
50.0
7.00
40.0
6.50
30.0
6.00
20.0
5.50
10.0
5.00
0.0
4.50
(10.0)
4.00
(20.0)
3.50
(30.0)
3.00
Source: Bloomberg, Angel Research
Source: RBI, Angel Research
Market Outlook
May 12, 2017
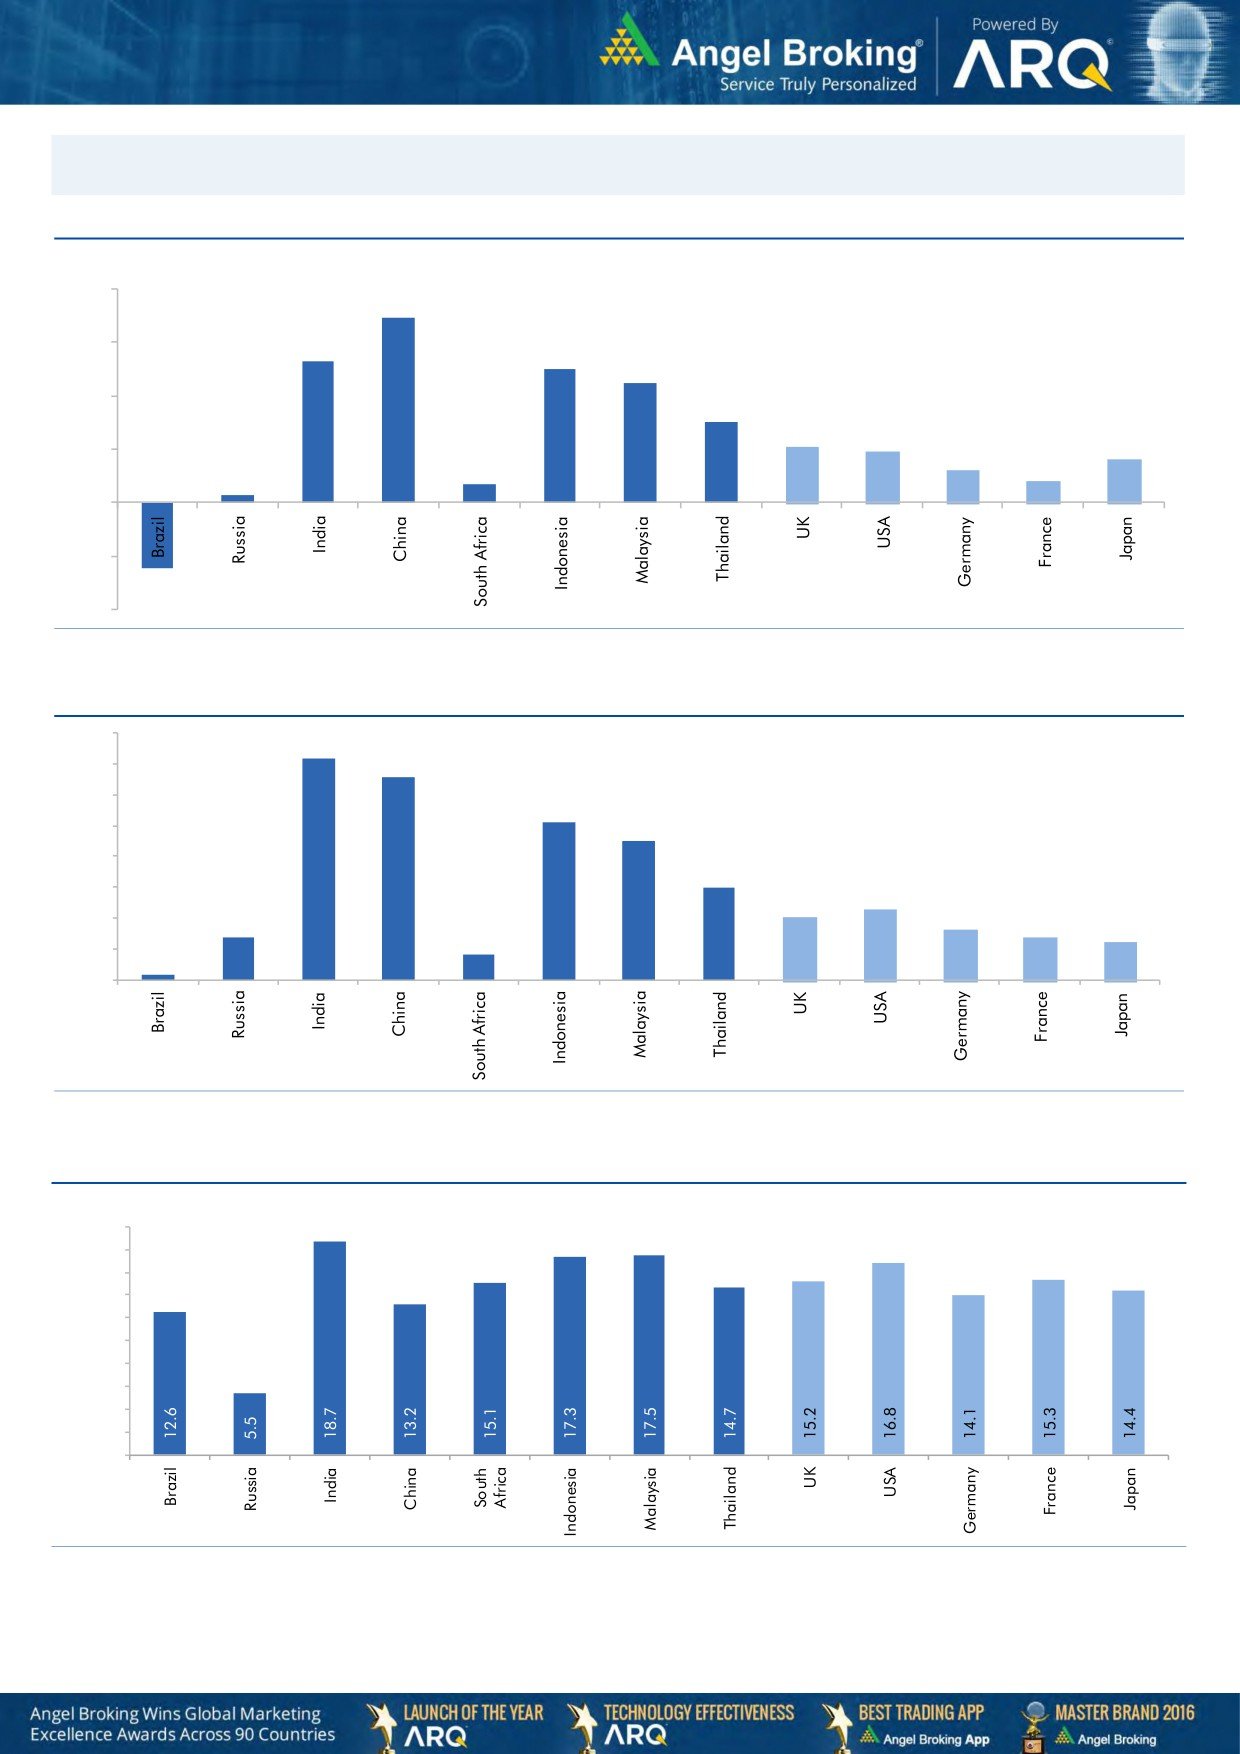
Global watch
Exhibit 1: Latest quarterly GDP Growth (%, yoy) across select developing and developed countries
(%)
8.0
6.9
6.0
5.3
5.0
0.7
4.5
4.0
3.0
2.1
1.9
0.3
1.6
2.0
1.2
0.8
-
(2.0)
(2.5)
(4.0)
Source: Bloomberg, Angel Research
Exhibit 2: 2016 GDP Growth projection by IMF (%, yoy) across select developing and developed countries
(%)
7.2
7.0
6.6
6.0
5.1
5.0
4.5
4.0
3.0
3.0
2.3
2.0
1.4
1.6
2.0
1.4
1.2
0.2
0.8
1.0
-
Source: IMF, Angel Research
Exhibit 3: One year forward P-E ratio across select developing and developed countries
(x)
20.0
18.0
16.0
14.0
12.0
10.0
8.0
6.0
4.0
2.0
-
Source: IMF, Angel Research
Market Outlook
May 12, 2017
Exhibit 4: Relative performance of indices across globe
Returns (%)
Country
Name of index
Closing price
1M
3M
1YR
Brazil
Bovespa
67,538
5.2
4.0
32.5
Russia
Micex
2,003
(2.5)
(10.1)
5.0
India
Nifty
9,422
2.4
7.8
21.8
China
Shanghai Composite
3,062
(6.9)
(3.3)
4.2
South Africa
Top 40
47,488
2.9
4.6
5.2
Mexico
Mexbol
49,531
1.1
4.9
8.4
Indonesia
LQ45
942
0.5
6.5
14.0
Malaysia
KLCI
1,775
1.9
5.1
7.1
Thailand
SET 50
989
(1.2)
0.7
11.5
USA
Dow Jones
20,919
1.3
4.3
18.1
UK
FTSE
7,387
1.1
2.8
20.3
Japan
Nikkei
19,962
7.3
5.2
19.8
Germany
DAX
12,711
3.9
10.1
27.8
France
CAC
5,383
5.1
13.2
25.7
Source: Bloomberg, Angel Research
Stock Watch
May 12, 2017
Company Name
Reco
CMP
Target
Mkt Cap
Sales ( Čcr )
OPM(%)
EPS (Č)
PER(x)
P/BV(x)
RoE(%)
EV/Sales(x)
(Č)
Price ( Č)
( Č cr )
FY17E
FY18E
FY17E
FY18E
FY17E
FY18E
FY17E
FY18E
FY17E
FY18E
FY17E
FY18E
FY17E
FY18E
Agri / Agri Chemical
Rallis
Neutral
250
-
4,854
1,937
2,164
13.3
14.3
9.0
11.0
27.7
22.7
4.8
4.2
18.4
19.8
2.6
2.2
United Phosphorus
Neutral
825
-
41,893
15,176
17,604
18.5
18.5
37.4
44.6
22.1
18.5
4.3
3.6
21.4
21.2
2.9
2.4
Auto & Auto Ancillary
Amara Raja Batteries
Accumulate
923
1,009
15,770
5,305
6,100
16.0
16.3
28.4
34.0
32.5
27.2
6.3
5.2
19.3
19.3
3.0
2.6
Apollo Tyres
Neutral
231
-
11,733
12,877
14,504
14.3
13.9
21.4
23.0
10.8
10.0
1.7
1.5
16.4
15.2
1.1
1.0
Ashok Leyland
Buy
86
111
24,560
20,021
21,915
11.6
11.9
4.5
5.3
19.2
16.2
3.9
3.5
20.6
21.5
1.2
1.0
Bajaj Auto
Neutral
2,998
-
86,759
25,093
27,891
19.5
19.2
143.9
162.5
20.8
18.5
5.9
5.0
30.3
29.4
3.2
2.8
Bharat Forge
Neutral
1,129
-
26,284
7,726
8,713
20.5
21.2
35.3
42.7
32.0
26.4
5.9
5.3
18.9
20.1
3.5
3.0
Ceat
Neutral
1,662
-
6,722
7,524
8,624
13.0
12.7
131.1
144.3
12.7
11.5
2.3
2.0
19.8
18.6
1.0
0.8
Eicher Motors
Neutral
29,402
-
80,004
16,583
20,447
17.5
18.0
598.0
745.2
49.2
39.5
16.8
12.8
41.2
38.3
4.7
3.7
Exide Industries
Neutral
248
-
21,055
7,439
8,307
15.0
15.0
8.1
9.3
30.6
26.6
4.3
3.8
14.3
16.7
2.4
2.2
Gabriel India
Neutral
129
-
1,858
1,544
1,715
9.0
9.3
5.4
6.3
24.0
20.5
4.5
4.0
18.9
19.5
1.2
1.0
Hero Motocorp
Neutral
3,464
-
69,171
28,083
30,096
15.3
15.7
171.8
187.0
20.2
18.5
7.0
5.9
30.1
27.9
2.3
2.1
Indag Rubber
Neutral
213
-
560
286
326
19.8
16.8
11.7
13.3
18.3
16.0
3.1
2.9
17.8
17.1
1.6
1.4
Jamna Auto Industries
Neutral
236
-
1,883
1,486
1,620
9.8
9.9
15.0
17.2
15.8
13.7
3.4
2.9
21.8
21.3
1.3
1.2
JK Tyres
Neutral
171
-
3,875
7,455
8,056
15.0
15.0
21.8
24.5
7.8
7.0
1.6
1.3
22.8
21.3
0.7
0.6
L G Balakrishnan & Bros Neutral
658
-
1,033
1,302
1,432
11.6
11.9
43.7
53.0
15.1
12.4
2.1
1.9
13.8
14.2
0.9
0.8
Mahindra and Mahindra Neutral
1,373
-
85,285
46,534
53,077
11.6
11.7
67.3
78.1
20.4
17.6
3.3
2.9
15.4
15.8
1.8
1.6
Maruti
Neutral
6,763
-
204,291
67,822
83,288
16.0
16.4
253.8
312.4
26.7
21.7
6.1
5.0
23.0
22.9
2.7
2.1
Minda Industries
Neutral
499
-
4,312
2,728
3,042
9.0
9.1
68.2
86.2
7.3
5.8
1.7
1.3
23.8
24.3
1.6
1.4
Motherson Sumi
Neutral
402
-
56,396
45,896
53,687
7.8
8.3
13.0
16.1
30.8
25.0
9.9
7.9
34.7
35.4
1.3
1.1
Rane Brake Lining
Neutral
1,021
-
808
511
562
11.3
11.5
28.1
30.9
36.3
33.0
5.5
5.0
15.3
15.0
1.7
1.6
Setco Automotive
Neutral
42
-
556
741
837
13.0
13.0
15.2
17.0
2.7
2.4
0.4
0.4
15.8
16.3
1.1
1.0
Subros
Neutral
258
-
1,548
1,488
1,681
11.7
11.9
6.4
7.2
40.3
36.0
4.3
3.9
10.8
11.4
1.3
1.1
Swaraj Engines
Neutral
1,817
-
2,257
660
810
15.2
16.4
54.5
72.8
33.3
25.0
10.4
9.4
31.5
39.2
3.2
2.6
Tata Motors
Neutral
427
-
123,405
300,209
338,549
8.9
8.4
42.7
54.3
10.0
7.9
1.6
1.4
15.6
17.2
0.5
0.5
TVS Motor
Neutral
499
-
23,719
13,390
15,948
6.9
7.1
12.8
16.5
39.1
30.2
9.7
7.7
26.3
27.2
1.8
1.5
Capital Goods
ACE
Neutral
67
-
659
709
814
4.1
4.6
1.4
2.1
47.6
31.7
2.0
1.9
4.4
6.0
1.1
1.0
BEML
Neutral
1,380
-
5,746
3,451
4,055
6.3
9.2
31.4
57.9
43.9
23.8
2.6
2.4
6.3
10.9
1.8
1.5
BGR Energy
Neutral
177
-
1,276
16,567
33,848
6.0
5.6
7.8
5.9
22.7
30.0
1.3
1.3
4.7
4.2
0.2
0.1
Stock Watch
May 12, 2017
Company Name
Reco
CMP
Target
Mkt Cap
Sales ( Čcr )
OPM(%)
EPS (Č)
PER(x)
P/BV(x)
RoE(%)
EV/Sales(x)
(Č)
Price ( Č)
( Č cr )
FY17E
FY18E
FY17E
FY18E
FY17E
FY18E
FY17E
FY18E
FY17E
FY18E
FY17E
FY18E
FY17E
FY18E
Capital Goods
Bharat Electronics
Neutral
182
-
40,596
8,137
9,169
16.8
17.2
58.7
62.5
3.1
2.9
0.5
0.4
44.6
46.3
4.0
3.6
BHEL
Neutral
174
-
42,649
28,797
34,742
-
2.8
2.3
6.9
75.8
25.3
1.3
1.3
1.3
4.8
1.1
0.8
Blue Star
Accumulate
676
760
6,458
4,283
5,077
5.9
7.3
14.9
22.1
45.4
30.5
8.8
7.4
20.4
26.4
1.6
1.3
CG Power and Industrial
Neutral
92
-
5,763
5,777
6,120
5.9
7.0
3.3
4.5
27.9
20.4
1.2
1.2
4.4
5.9
1.0
0.8
Solutions
Greaves Cotton
Neutral
161
-
3,924
1,755
1,881
16.8
16.9
7.8
8.5
20.6
18.9
4.1
3.8
20.6
20.9
1.9
1.8
Inox Wind
Neutral
199
-
4,413
5,605
6,267
15.7
16.4
24.8
30.0
8.0
6.6
2.2
1.6
25.9
24.4
0.8
0.7
KEC International
Neutral
237
-
6,098
9,294
10,186
7.9
8.1
9.9
11.9
24.0
19.9
3.5
3.1
15.6
16.3
0.9
0.8
KEI Industries
Accumulate
222
239
1,724
2,682
3,058
10.4
10.0
11.7
12.8
18.9
17.3
3.8
3.2
20.1
18.2
0.8
0.7
Thermax
Neutral
1,035
-
12,334
5,421
5,940
7.3
7.3
25.7
30.2
40.3
34.3
4.9
4.5
12.2
13.1
2.2
2.0
VATech Wabag
Neutral
666
-
3,632
3,136
3,845
8.9
9.1
26.0
35.9
25.6
18.5
3.2
2.7
13.4
15.9
1.1
0.8
Voltas
Neutral
439
-
14,537
6,511
7,514
7.9
8.7
12.9
16.3
34.1
27.0
6.1
5.4
16.7
18.5
2.0
1.7
Cement
ACC
Neutral
1,693
-
31,793
11,225
13,172
13.2
16.9
44.5
75.5
38.1
22.4
3.6
3.3
11.2
14.2
2.8
2.4
Ambuja Cements
Neutral
260
-
51,607
9,350
10,979
18.2
22.5
5.8
9.5
44.8
27.4
3.8
3.4
10.2
12.5
5.5
4.7
India Cements
Neutral
213
-
6,541
4,364
4,997
18.5
19.2
7.9
11.3
27.0
18.9
1.9
1.9
8.0
8.5
2.3
2.0
J K Lakshmi Cement
Neutral
501
-
5,899
2,913
3,412
14.5
19.5
7.5
22.5
66.9
22.3
4.1
3.5
12.5
18.0
2.6
2.2
JK Cement
Neutral
1,053
-
7,360
4,398
5,173
15.5
17.5
31.2
55.5
33.7
19.0
4.1
3.5
12.0
15.5
2.2
1.9
Orient Cement
Neutral
166
-
3,391
2,114
2,558
18.5
20.5
8.1
11.3
20.4
14.7
3.0
2.6
9.0
14.0
2.2
1.7
UltraTech Cement
Neutral
4,403
-
120,873
25,768
30,385
21.0
23.5
111.0
160.0
39.7
27.5
5.1
4.4
13.5
15.8
4.8
4.0
Construction
Engineers India
Neutral
166
-
11,173
1,725
1,935
16.0
19.1
11.4
13.9
14.5
11.9
2.0
1.9
13.4
15.3
5.4
4.8
Gujarat Pipavav Port
Neutral
166
-
8,008
705
788
52.2
51.7
5.0
5.6
33.1
29.6
3.3
2.9
11.2
11.2
11.0
9.4
ITNL
Neutral
120
-
3,934
8,946
10,017
31.0
31.6
8.1
9.1
14.8
13.1
0.5
0.6
4.2
5.0
3.8
3.5
KNR Constructions
Neutral
205
-
2,876
1,385
1,673
14.7
14.0
41.2
48.5
5.0
4.2
0.9
0.8
14.9
15.2
2.2
1.8
Larsen & Toubro
Neutral
1,736
-
162,039
111,017
124,908
11.0
11.0
61.1
66.7
28.4
26.0
3.4
3.2
13.1
12.9
2.5
2.3
MEP Infra
Neutral
72
-
1,172
1,877
1,943
30.6
29.8
3.0
4.2
24.0
17.2
11.6
7.8
0.6
0.6
2.0
1.8
Nagarjuna Const.
Neutral
97
-
5,370
8,842
9,775
9.1
8.8
5.3
6.4
18.2
15.1
1.4
1.3
8.2
9.1
0.8
0.7
NBCC
Neutral
196
-
17,649
7,428
9,549
7.9
8.6
8.2
11.0
23.9
17.8
1.2
0.9
28.2
28.7
2.1
1.6
PNC Infratech
Neutral
158
-
4,053
2,350
2,904
13.1
13.2
9.0
8.8
17.6
18.0
0.6
0.6
15.9
13.9
1.8
1.5
Power Mech Projects
Neutral
610
-
897
1,801
2,219
12.7
14.6
72.1
113.9
8.5
5.4
1.6
1.3
16.8
11.9
0.5
0.4
Sadbhav Engineering
Neutral
343
-
5,877
3,598
4,140
10.3
10.6
9.0
11.9
38.1
28.8
4.0
3.5
9.9
11.9
1.9
1.6
Stock Watch
May 12, 2017
Company Name
Reco
CMP
Target
Mkt Cap
Sales ( Čcr )
OPM(%)
EPS (Č)
PER(x)
P/BV(x)
RoE(%)
EV/Sales(x)
(Č)
Price ( Č)
( Č cr )
FY17E
FY18E
FY17E
FY18E
FY17E
FY18E
FY17E
FY18E
FY17E
FY18E
FY17E
FY18E
FY17E
FY18E
Construction
Simplex Infra
Neutral
414
-
2,048
6,829
7,954
10.5
10.5
31.4
37.4
13.2
11.1
1.4
1.3
9.9
13.4
0.7
0.6
SIPL
Neutral
106
-
3,720
1,036
1,252
65.5
66.2
(8.4)
(5.6)
4.0
4.5
(22.8)
(15.9)
11.8
9.8
Financials
Axis Bank
Accumulate
517
580
123,921
46,932
53,575
3.5
3.4
32.4
44.6
16.0
11.6
2.1
1.8
13.6
16.5
-
-
Bank of Baroda
Neutral
188
-
43,295
19,980
23,178
1.8
1.8
11.5
17.3
16.3
10.9
1.9
1.5
8.3
10.1
-
-
Can Fin Homes
Neutral
2,741
-
7,295
420
526
3.5
3.5
86.5
107.8
31.7
25.4
6.8
5.6
23.6
24.1
-
-
Canara Bank
Neutral
371
-
22,165
15,225
16,836
1.8
1.8
14.5
28.0
25.6
13.3
1.8
1.4
5.8
8.5
-
-
Cholamandalam Inv. &
Accumulate
1,096
1,230
17,129
2,012
2,317
6.3
6.3
42.7
53.6
25.7
20.5
4.1
3.5
16.9
18.3
-
-
Fin. Co.
Dewan Housing Finance Buy
442
520
13,837
2,225
2,688
2.9
2.9
29.7
34.6
14.9
12.8
2.4
1.6
16.1
14.8
-
-
Equitas Holdings
Buy
165
235
5,584
939
1,281
11.7
11.5
5.8
8.2
28.5
20.2
2.5
2.2
10.9
11.5
-
-
Federal Bank
Accumulate
116
125
20,002
8,259
8,995
3.0
3.0
4.3
5.6
27.0
20.7
2.3
2.1
8.5
10.1
-
-
HDFC
Neutral
1,562
-
248,102
11,475
13,450
3.4
3.4
45.3
52.5
34.5
29.8
6.7
5.9
20.2
20.5
-
-
HDFC Bank
Accumulate
1,547
1,650
396,740
46,097
55,433
4.5
4.5
58.4
68.0
26.5
22.8
4.6
3.9
18.8
18.6
-
-
ICICI Bank
Neutral
300
-
174,972
42,800
44,686
3.1
3.3
18.0
21.9
16.7
13.7
2.3
2.1
11.1
12.3
-
-
Karur Vysya Bank
Buy
118
140
7,152
5,640
6,030
3.3
3.2
8.9
10.0
13.3
11.8
1.4
1.3
11.2
11.4
-
-
Lakshmi Vilas Bank
Neutral
186
-
3,553
3,339
3,799
2.7
2.8
11.0
14.0
16.9
13.3
1.8
1.6
11.2
12.7
-
-
LIC Housing Finance
Neutral
690
-
34,839
3,712
4,293
2.6
2.5
39.0
46.0
17.7
15.0
3.3
2.8
19.9
20.1
-
-
Punjab Natl.Bank
Neutral
172
-
36,612
23,532
23,595
2.3
2.4
6.8
12.6
25.3
13.7
3.9
2.8
3.3
6.5
-
-
RBL Bank
Neutral
561
-
21,053
1,783
2,309
2.6
2.6
12.7
16.4
44.2
34.2
4.8
4.3
12.8
13.3
-
-
Repco Home Finance
Accumulate
755
825
4,720
388
457
4.5
4.2
30.0
38.0
25.2
19.9
4.2
3.5
18.0
19.2
-
-
South Ind.Bank
Neutral
26
-
4,696
6,435
7,578
2.5
2.5
2.7
3.1
9.7
8.4
1.2
1.0
10.1
11.2
-
-
St Bk of India
Neutral
298
-
241,674
88,650
98,335
2.6
2.6
13.5
18.8
22.1
15.9
2.1
1.8
7.0
8.5
-
-
Union Bank
Neutral
178
-
12,247
13,450
14,925
2.3
2.3
25.5
34.5
7.0
5.2
1.0
0.9
7.5
10.2
-
-
Yes Bank
Neutral
1,579
-
72,119
8,978
11,281
3.3
3.4
74.0
90.0
21.3
17.6
4.1
3.4
17.0
17.2
-
-
FMCG
Akzo Nobel India
Neutral
1,921
-
9,213
2,955
3,309
13.3
13.7
57.2
69.3
33.6
27.7
11.0
9.2
32.7
33.3
2.9
2.6
Asian Paints
Neutral
1,168
-
112,015
17,128
18,978
16.8
16.4
19.1
20.7
61.1
56.4
21.3
20.1
34.8
35.5
6.5
5.8
Britannia
Neutral
3,697
-
44,362
9,594
11,011
14.6
14.9
80.3
94.0
46.0
39.3
18.9
14.6
41.2
-
4.5
3.9
Colgate
Neutral
1,007
-
27,401
4,605
5,149
23.4
23.4
23.8
26.9
42.3
37.5
23.4
18.3
64.8
66.8
5.9
5.2
Dabur India
Accumulate
278
304
49,041
8,315
9,405
19.8
20.7
8.1
9.2
34.4
30.3
9.6
7.9
31.6
31.0
5.6
4.9
GlaxoSmith Con*
Neutral
5,251
-
22,083
4,350
4,823
21.2
21.4
179.2
196.5
29.3
26.7
7.8
6.6
27.1
26.8
4.5
3.9
Stock Watch
May 12, 2017
Company Name
Reco
CMP
Target
Mkt Cap
Sales ( Čcr )
OPM(%)
EPS (Č)
PER(x)
P/BV(x)
RoE(%)
EV/Sales(x)
(Č)
Price ( Č)
( Č cr )
FY17E FY18E
FY17E
FY18E
FY17E
FY18E
FY17E
FY18E
FY17E
FY18E
FY17E
FY18E
FY17E
FY18E
FMCG
Godrej Consumer
Neutral
1,909
-
65,028
10,235
11,428
18.4
18.6
41.1
44.2
46.5
43.2
10.3
8.7
24.9
24.8
6.4
5.7
HUL
Neutral
978
-
211,706
35,252
38,495
17.8
17.8
20.7
22.4
47.4
43.7
45.3
38.8
95.6
88.9
5.8
5.3
ITC
Neutral
277
-
336,057
40,059
44,439
38.3
39.2
9.0
10.1
30.8
27.3
8.6
7.5
27.8
27.5
7.9
7.1
Marico
Neutral
312
-
40,263
6,430
7,349
18.8
19.5
6.4
7.7
48.8
40.5
14.7
12.4
33.2
32.5
6.1
5.3
Nestle*
Neutral
6,852
-
66,065
10,073
11,807
20.7
21.5
124.8
154.2
54.9
44.4
22.5
20.3
34.8
36.7
6.4
5.4
Procter & Gamble
Neutral
7,700
-
24,996
2,939
3,342
23.2
23.0
146.2
163.7
52.7
47.0
13.3
11.1
25.3
23.5
8.0
7.0
Hygiene
Tata Global
Neutral
154
-
9,719
8,675
9,088
9.8
9.8
7.4
8.2
20.8
18.8
1.6
1.6
7.9
8.1
1.0
1.0
IT
HCL Tech^
Buy
839
1,000
119,688
49,242
57,168
20.5
20.5
55.7
64.1
15.1
13.1
3.1
2.3
20.3
17.9
2.3
1.9
Infosys
Buy
944
1,179
216,797
68,484
73,963
26.0
26.0
63.0
64.0
15.0
14.8
3.2
2.9
20.8
19.7
2.8
2.5
TCS
Accumulate
2,351
2,651
463,297
117,966
127,403
27.5
27.6
134.3
144.5
17.5
16.3
5.2
4.8
29.8
29.7
3.6
3.3
Tech Mahindra
Buy
434
600
42,318
29,673
32,937
15.5
17.0
32.8
39.9
13.2
10.9
2.6
2.3
19.6
20.7
1.2
1.0
Wipro
Accumulate
505
570
122,779
55,421
58,536
20.3
20.3
35.1
36.5
14.4
13.8
2.5
2.1
19.2
14.6
1.6
1.4
Media
D B Corp
Neutral
373
-
6,864
2,297
2,590
27.4
28.2
21.0
23.4
17.8
16.0
4.2
3.6
23.7
23.1
2.8
2.4
Hindustan Media
Neutral
281
-
2,062
1,016
1,138
24.3
25.2
27.3
30.1
10.3
9.3
2.0
1.7
16.2
15.8
1.4
1.2
Ventures
HT Media
Neutral
84
-
1,946
2,693
2,991
12.6
12.9
7.9
9.0
10.6
9.3
0.9
0.8
7.8
8.3
0.3
0.2
Jagran Prakashan
Buy
193
225
6,308
2,355
2,635
28.0
28.0
10.8
12.5
17.9
15.4
3.9
3.4
21.7
21.7
2.7
2.4
Sun TV Network
Neutral
909
-
35,828
2,850
3,265
70.1
71.0
26.2
30.4
34.7
29.9
8.9
7.8
24.3
25.6
12.2
10.5
TV Today Network
Buy
275
344
1,639
567
645
26.7
27.0
15.4
18.1
17.9
15.2
2.7
2.3
14.9
15.2
2.5
2.1
Metals & Mining
Coal India
Neutral
275
-
170,673
84,638
94,297
21.4
22.3
24.5
27.1
11.2
10.2
4.7
4.5
42.6
46.0
1.5
1.4
Hind. Zinc
Neutral
259
-
109,436
14,252
18,465
55.9
48.3
15.8
21.5
16.4
12.1
2.7
2.3
17.0
20.7
7.7
5.9
Hindalco
Neutral
193
-
43,386
107,899
112,095
7.4
8.2
9.2
13.0
21.0
14.9
1.0
1.0
4.8
6.6
0.9
0.9
JSW Steel
Neutral
195
-
47,124
53,201
58,779
16.1
16.2
130.6
153.7
1.5
1.3
0.2
0.2
14.0
14.4
1.6
1.4
NMDC
Neutral
125
-
39,533
6,643
7,284
44.4
47.7
7.1
7.7
17.6
16.2
1.5
1.5
8.8
9.2
3.7
3.3
SAIL
Neutral
61
-
25,194
47,528
53,738
(0.7)
2.1
(1.9)
2.6
23.5
0.7
0.6
(1.6)
3.9
1.4
1.3
Tata Steel
Neutral
440
-
42,772
121,374
121,856
7.2
8.4
18.6
34.3
23.7
12.8
1.5
1.4
6.1
10.1
1.0
1.0
Vedanta
Neutral
236
-
69,967
71,744
81,944
19.2
21.7
13.4
20.1
17.6
11.7
1.5
1.4
8.4
11.3
1.4
1.1
Oil & Gas
Cairn India
#VALUE!
9,127
10,632
4.3
20.6
8.8
11.7
3.3
4.2
GAIL
Neutral
409
-
69,124
56,220
65,198
9.3
10.1
27.1
33.3
15.1
12.3
1.4
1.3
9.3
10.7
1.4
1.2
Indian Oil Corp
Neutral
433
-
210,139
373,359
428,656
5.9
5.5
54.0
59.3
8.0
7.3
1.2
1.1
16.0
15.6
0.7
0.6
Stock Watch
May 12, 2017
Company Name
Reco
CMP
Target
Mkt Cap
Sales ( Čcr )
OPM(%)
EPS (Č)
PER(x)
P/BV(x)
RoE(%)
EV/Sales(x)
(Č)
Price ( Č)
( Č cr )
FY17E FY18E
FY17E
FY18E
FY17E
FY18E
FY17E
FY18E
FY17E
FY18E
FY17E
FY18E
FY17E
FY18E
Oil & Gas
ONGC
Neutral
184
-
236,388
137,222
152,563
15.0
21.8
19.5
24.1
9.5
7.6
0.8
0.8
8.5
10.1
2.0
1.8
Reliance Industries
Neutral
1,357
-
441,108
301,963
358,039
12.1
12.6
87.7
101.7
15.5
13.3
1.6
1.4
10.7
11.3
1.9
1.6
Pharmaceuticals
Alembic Pharma
Accumulate
609
648
11,484
3,101
3,966
19.7
20.5
21.4
25.5
28.5
23.9
6.0
4.9
23.0
22.8
3.7
2.7
Alkem Laboratories Ltd
Buy
1,924
2,257
23,002
6,065
7,009
18.7
20.0
80.2
92.0
24.0
20.9
5.4
4.5
22.5
21.6
3.7
3.2
Aurobindo Pharma
Buy
624
877
36,533
15,720
18,078
23.7
23.7
41.4
47.3
15.1
13.2
3.9
3.1
29.6
26.1
2.5
2.2
Aventis*
Neutral
4,213
-
9,702
2,206
2,508
16.6
16.8
128.9
139.9
32.7
30.1
5.6
4.4
21.6
23.5
4.2
3.5
Cadila Healthcare
Neutral
492
-
50,358
10,429
12,318
17.7
21.6
13.1
19.2
37.6
25.6
7.9
6.2
22.8
27.1
4.9
4.0
Cipla
Sell
561
465
45,135
15,378
18,089
15.7
16.8
19.3
24.5
29.1
22.9
3.4
3.0
12.3
13.9
3.1
2.6
Dishman Pharma
Sell
307
143
4,961
1,718
1,890
22.7
22.8
9.5
11.3
32.4
27.2
3.1
2.8
10.1
10.9
3.4
3.0
Dr Reddy's
Neutral
2,592
-
42,950
16,043
18,119
18.0
23.0
78.6
130.9
33.0
19.8
3.2
2.8
10.1
15.2
2.4
2.4
GSK Pharma*
Neutral
2,435
-
20,624
2,800
3,290
10.2
20.6
32.2
60.3
75.6
40.4
14.0
13.8
17.2
34.5
7.1
6.1
Indoco Remedies
Accumulate
225
240
2,069
1,112
1,289
16.2
18.2
11.6
16.0
19.4
14.0
3.1
2.6
17.0
20.1
2.0
1.7
Ipca labs
Accumulate
560
613
7,066
3,258
3,747
12.8
15.3
12.1
19.2
46.3
29.2
2.9
2.7
6.4
9.5
2.3
2.0
Lupin
Buy
1,259
1,809
56,879
15,912
18,644
26.4
26.7
58.1
69.3
21.7
18.2
4.2
3.5
21.4
20.9
3.6
3.0
Natco Pharma
Accumulate
915
974
15,940
2,090
2,335
32.1
26.6
26.8
23.2
34.1
39.5
9.7
8.3
28.4
21.1
7.7
94.4
Sun Pharma
Buy
648
847
155,554
31,129
35,258
32.0
32.9
30.2
35.3
21.5
18.4
3.5
2.9
20.0
20.1
4.6
3.8
Power
NTPC
Neutral
160
-
131,927
86,605
95,545
17.5
20.8
11.8
13.4
13.6
11.9
1.4
1.3
10.5
11.1
2.9
2.9
Power Grid
Accumulate
208
223
108,869
25,315
29,193
88.2
88.7
14.2
17.2
14.7
12.1
2.2
2.0
15.2
16.1
8.9
8.0
Tata Power
Neutral
83
-
22,341
36,916
39,557
17.4
27.1
5.1
6.3
16.2
13.1
1.4
1.3
9.0
10.3
1.6
1.5
Real Estate
MLIFE
Accumulate
459
522
1,886
1,152
1,300
22.7
24.6
29.9
35.8
15.4
12.8
1.1
1.1
7.6
8.6
2.4
2.0
Prestige Estate
Neutral
246
-
9,225
4,707
5,105
25.2
26.0
10.3
13.0
23.9
18.9
1.9
1.8
10.3
10.2
3.1
2.8
Telecom
Bharti Airtel
Neutral
366
-
146,345
105,086
114,808
34.5
34.7
12.2
16.4
30.0
22.3
2.0
1.9
6.8
8.4
2.3
2.0
Idea Cellular
Neutral
91
-
32,741
40,133
43,731
37.2
37.1
6.4
6.5
14.2
14.0
1.2
1.1
8.2
7.6
1.8
1.6
zOthers
Abbott India
Neutral
4,298
-
9,133
3,153
3,583
14.1
14.4
152.2
182.7
28.2
23.5
138.7
118.4
25.6
26.1
2.6
2.2
Asian Granito
Neutral
386
-
1,162
1,060
1,169
12.2
12.5
12.7
15.9
30.5
24.3
2.9
2.6
9.5
10.7
1.4
1.2
Bajaj Electricals
Accumulate
351
395
3,560
4,801
5,351
5.7
6.2
10.4
13.7
33.7
25.7
4.2
3.7
12.4
14.5
0.7
0.7
Banco Products (India)
Neutral
229
-
1,638
1,353
1,471
12.3
12.4
14.5
16.3
15.8
14.1
21.8
19.7
14.5
14.6
1.2
123.8
Coffee Day Enterprises
Neutral
262
-
5,396
2,964
3,260
20.5
21.2
4.7
8.0
-
32.7
3.0
2.8
5.5
8.5
2.2
2.0
Ltd
Competent Automobiles Neutral
223
-
143
1,137
1,256
3.1
2.7
28.0
23.6
8.0
9.5
42.9
38.8
14.3
11.5
0.1
0.1
Stock Watch
May 12, 2017
Company Name
Reco
CMP
Target
Mkt Cap
Sales ( Čcr )
OPM(%)
EPS (Č)
PER(x)
P/BV(x)
RoE(%)
EV/Sales(x)
(Č)
Price ( Č)
( Č cr )
FY17E
FY18E
FY17E
FY18E
FY17E
FY18E
FY17E
FY18E
FY17E
FY18E
FY17E
FY18E
FY17E
FY18E
zOthers
Elecon Engineering
Neutral
62
-
698
1,482
1,660
13.7
14.5
3.9
5.8
16.0
10.7
3.8
3.4
7.8
10.9
0.8
0.7
Finolex Cables
Neutral
533
-
8,156
2,883
3,115
12.0
12.1
14.2
18.6
37.6
28.7
20.0
17.5
15.8
14.6
2.5
2.3
Garware Wall Ropes
Neutral
811
-
1,775
863
928
15.1
15.2
36.4
39.4
22.3
20.6
4.0
3.4
17.5
15.9
2.0
1.8
Goodyear India*
Neutral
849
-
1,959
1,598
1,704
10.4
10.2
49.4
52.6
17.2
16.2
79.4
69.6
18.2
17.0
0.9
129.4
Hitachi
Neutral
1,820
-
4,948
2,081
2,433
8.8
8.9
33.4
39.9
54.5
45.6
44.0
36.6
22.1
21.4
2.4
2.0
HSIL
Neutral
345
-
2,497
2,384
2,515
15.8
16.3
15.3
19.4
22.6
17.8
22.4
19.3
7.8
9.3
1.2
1.1
Interglobe Aviation
Neutral
1,093
-
39,494
21,122
26,005
14.5
27.6
110.7
132.1
9.9
8.3
59.1
42.2
168.5
201.1
1.8
1.5
Jyothy Laboratories
Neutral
376
-
6,835
1,440
2,052
11.5
13.0
8.5
10.0
44.3
37.6
10.7
9.9
18.6
19.3
5.0
3.5
Kirloskar Engines India
Neutral
398
-
5,753
2,554
2,800
9.9
10.0
10.5
12.1
37.9
32.9
15.9
15.0
10.7
11.7
1.9
1.7
Ltd
Linc Pen & Plastics
Neutral
292
-
431
382
420
9.3
9.5
13.5
15.7
21.6
18.6
3.7
3.2
17.1
17.3
1.2
1.1
M M Forgings
Neutral
622
-
751
546
608
20.4
20.7
41.3
48.7
15.1
12.8
85.2
75.4
16.6
17.0
1.2
1.1
Manpasand Bever.
Neutral
696
-
3,985
836
1,087
19.6
19.4
16.9
23.8
41.2
29.2
4.9
4.3
12.0
14.8
4.5
3.4
Mirza International
Neutral
126
-
1,521
963
1,069
17.2
18.0
6.1
7.5
20.6
16.8
3.2
2.7
15.0
15.7
1.8
1.6
MT Educare
Neutral
83
-
329
366
417
17.7
18.2
9.4
10.8
8.8
7.7
2.0
1.7
22.2
22.3
0.8
0.7
Narayana Hrudaya
Neutral
310
-
6,330
1,873
2,166
11.5
11.7
2.6
4.0
117.1
78.1
7.2
6.5
6.1
8.3
3.5
3.0
Navkar Corporation
Buy
218
265
3,105
369
561
42.9
42.3
6.9
11.5
31.5
18.9
2.2
2.0
7.4
10.5
9.4
6.2
Navneet Education
Neutral
165
-
3,843
1,062
1,147
24.0
24.0
6.1
6.6
27.0
24.8
5.6
4.9
20.6
19.8
3.7
3.4
Nilkamal
Neutral
2,260
-
3,372
1,995
2,165
10.7
10.4
69.8
80.6
32.4
28.0
129.1
112.2
16.6
16.5
1.7
1.5
Page Industries
Neutral
14,767
-
16,471
2,450
3,124
20.1
17.6
299.0
310.0
49.4
47.6
328.9
251.1
47.1
87.5
6.8
5.3
Parag Milk Foods
Neutral
248
-
2,086
1,919
2,231
9.3
9.6
9.5
12.9
26.3
19.2
4.1
3.4
15.5
17.5
1.2
1.1
Quick Heal
Neutral
244
-
1,712
408
495
27.3
27.0
7.7
8.8
31.6
27.8
2.9
2.9
9.3
10.6
3.3
2.8
Radico Khaitan
Accumulate
128
147
1,707
1,667
1,824
13.0
13.2
6.7
8.2
19.3
15.7
1.7
1.6
9.0
10.2
1.4
1.3
Relaxo Footwears
Neutral
483
-
5,801
2,085
2,469
9.2
8.2
7.6
8.0
63.9
60.8
24.8
21.1
17.9
18.8
2.9
2.5
S H Kelkar & Co.
Neutral
315
-
4,556
1,036
1,160
15.1
15.0
6.1
7.2
51.6
43.9
5.5
5.1
10.7
11.5
4.3
3.8
Siyaram Silk Mills
Accumulate
1,707
1,872
1,600
1,652
1,857
11.6
11.7
92.4
110.1
18.5
15.5
2.7
2.4
14.7
15.2
1.2
1.0
Styrolution ABS India*
Neutral
710
-
1,249
1,440
1,537
9.2
9.0
40.6
42.6
17.5
16.7
44.7
40.6
12.3
11.6
0.8
0.7
Surya Roshni
Neutral
279
-
1,225
3,342
3,625
7.8
7.5
17.3
19.8
16.2
14.1
30.7
24.6
10.5
10.8
0.6
0.6
Team Lease Serv.
Neutral
1,120
-
1,915
3,229
4,001
1.5
1.8
22.8
32.8
49.2
34.1
5.3
4.6
10.7
13.4
0.5
0.4
The Byke Hospitality
Neutral
208
-
832
287
384
20.5
20.5
7.6
10.7
27.3
19.4
5.7
4.6
20.7
23.5
2.9
2.2
Stock Watch
May 12, 2017
Company Name
Reco
CMP
Target Mkt Cap
Sales ( Čcr )
OPM(%)
EPS (Č)
PER(x)
P/BV(x)
RoE(%)
EV/Sales(x)
(Č)
Price ( Č)
( Č cr )
FY17E FY18E FY17E FY18E FY17E FY18E FY17E FY18E FY17E FY18E FY17E FY18E FY17E FY18E
zOthers
Transport Corporation of
Neutral
248
-
1,898
2,671
2,911
8.5
8.8
13.9
15.7
17.9
15.8
2.4
2.2
13.7
13.8
0.8
0.8
India
TVS Srichakra
Neutral
4,025
-
3,082
2,304
2,614
13.7
13.8
231.1
266.6
17.4
15.1
452.3
356.1
33.9
29.3
1.3
1.2
UFO Moviez
Neutral
441
-
1,218
619
685
33.2
33.4
30.0
34.9
14.7
12.6
2.0
1.8
13.8
13.9
1.7
1.3
Visaka Industries
Neutral
360
-
571
1,051
1,138
10.3
10.4
21.0
23.1
17.1
15.5
46.1
43.2
9.0
9.2
0.8
0.8
VRL Logistics
Neutral
325
-
2,966
1,902
2,119
16.7
16.6
14.6
16.8
22.3
19.3
4.9
4.3
21.9
22.2
1.7
1.5
Wonderla Holidays
Neutral
382
-
2,158
287
355
38.0
40.0
11.3
14.2
33.8
26.9
4.8
4.2
21.4
23.9
7.2
5.8
VIP Industries
Accumulate
198
218
2,792
1,270
1,450
10.4
10.4
5.6
6.5
35.3
30.4
7.3
6.4
20.7
21.1
2.2
1.9
Navin Fluorine
Buy
3,045
3,650
2,982
789
945
21.1
22.4
120.1
143.4
25.4
21.2
4.1
3.5
17.8
18.5
3.7
3.0
Source: Company, Angel Research; Note: *December year end; #September year end; &October year end; Price as on May 11, 2017
Market Outlook
May 12, 2017
Research Team Tel: 022 - 39357800
DISCLAIMER
Angel Broking Private Limited (hereinafter referred to as “Angel”) is a registered Member of National Stock Exchange of India
Limited,Bombay Stock Exchange Limited and Metropolitan Stock Exchange Limited. It is also registered as a Depository Participant with
CDSL and Portfolio Manager with SEBI. It also has registration with AMFI as a Mutual Fund Distributor. Angel Broking Private Limited is a
registered entity with SEBI for Research Analyst in terms of SEBI (Research Analyst) Regulations, 2014 vide registration number
INH000000164. Angel or its associates has not been debarred/ suspended by SEBI or any other regulatory authority for accessing
/dealing in securities Market. Angel or its associates/analyst has not received any compensation / managed or
co-managed public offering of securities of the company covered by Analyst during the past twelve months.
This document is solely for the personal information of the recipient, and must not be singularly used as the basis of any investment
decision. Nothing in this document should be construed as investment or financial advice. Each recipient of this document should make
such investigations as they deem necessary to arrive at an independent evaluation of an investment in the securities of the companies
referred to in this document (including the merits and risks involved), and should consult their own advisors to determine the merits and
risks of such an investment.
Reports based on technical and derivative analysis center on studying charts of a stock's price movement, outstanding positions and
trading volume, as opposed to focusing on a company's fundamentals and, as such, may not match with a report on a company's
fundamentals. Investors are advised to refer the Fundamental and Technical Research Reports available on our website to evaluate the
contrary view, if any.
The information in this document has been printed on the basis of publicly available information, internal data and other reliable
sources believed to be true, but we do not represent that it is accurate or complete and it should not be relied on as such, as this
document is for general guidance only. Angel Broking Pvt. Limited or any of its affiliates/ group companies shall not be in any way
responsible for any loss or damage that may arise to any person from any inadvertent error in the information contained in this report.
Angel Broking Pvt. Limited has not independently verified all the information contained within this document. Accordingly, we cannot
testify, nor make any representation or warranty, express or implied, to the accuracy, contents or data contained within this document.
While Angel Broking Pvt. Limited endeavors to update on a reasonable basis the information discussed in this material, there may be
regulatory, compliance, or other reasons that prevent us from doing so.
This document is being supplied to you solely for your information, and its contents, information or data may not be reproduced,
redistributed or passed on, directly or indirectly.
Neither Angel Broking Pvt. Limited, nor its directors, employees or affiliates shall be liable for any loss or damage that may arise from
or in connection with the use of this information.